Most agencies running Meta ads for finance brands treat their Telegram channel as a vanity metric. They watch the member count climb, they tell the client “engagement is up”, and they have no idea which campaign, ad set, or creative actually drove a single join. That guesswork is fine until the broker asks why CHF 12,000 of spend produced members who never deposit.
This is a teardown of how one agency grew a forex broker’s Telegram channel from roughly 600 to over 8,000 members across a quarter, while keeping cost-per-join and cost-per-FTD visible the whole way. The numbers are illustrative of a typical regulated-niche funnel — but more to the point, this is what the whole playbook looks like when you run it on Ott: each join attributed back to the ad that caused it via the Facebook Click ID (fbclid), fed to Meta through the Conversions API, with FTDs and budgets in the same place.
Why generic Telegram growth advice fails in finance
The standard playbook (lookalikes, video creative, gradual scaling) is not wrong. It is just measured against the wrong outcome. In a forex, crypto, iGaming, or signals funnel, a Telegram join is not the goal. It is the second step in a chain that ends at a first-time deposit. An agency that optimises purely for cheap joins will happily scale an ad set that floods the channel with members who never fund an account.
Two finance-specific realities also break the textbook approach:
- Account bans and Business Manager churn. Regulated verticals get restricted constantly. If your attribution lives inside a single Business Manager that gets disabled, your history disappears with it. You need tracking that survives a multi-Business-Manager setup.
- The deposit happens off-platform. The join is in Telegram. The FTD is in the broker’s CRM. Meta sees neither unless you send the signal back. Without server-side conversions, the algorithm is optimising blind.
So the real brief was never “grow the channel”. It was “grow the channel with members who deposit, and prove which ads did it”.
Campaign overview
- Client: a forex broker running a free signals channel as the top of the funnel
- Vertical: regulated FX, EU and LATAM traffic
- Objective: Telegram joins that convert to first-time deposits
- Timeline: 90 days
- Budget: roughly CHF 12,000 total, scaled gradually
- Primary metric: cost-per-FTD, with cost-per-join as the leading indicator
The funnel was simple: Meta ad → click (carrying the fbclid) → Telegram channel join → bot welcome sequence → broker sign-up → first deposit. The hard part is not the funnel. It is keeping a clean thread of attribution from the first click all the way to the deposit.
Phase 1: Attribution before spend (Weeks 1-2)
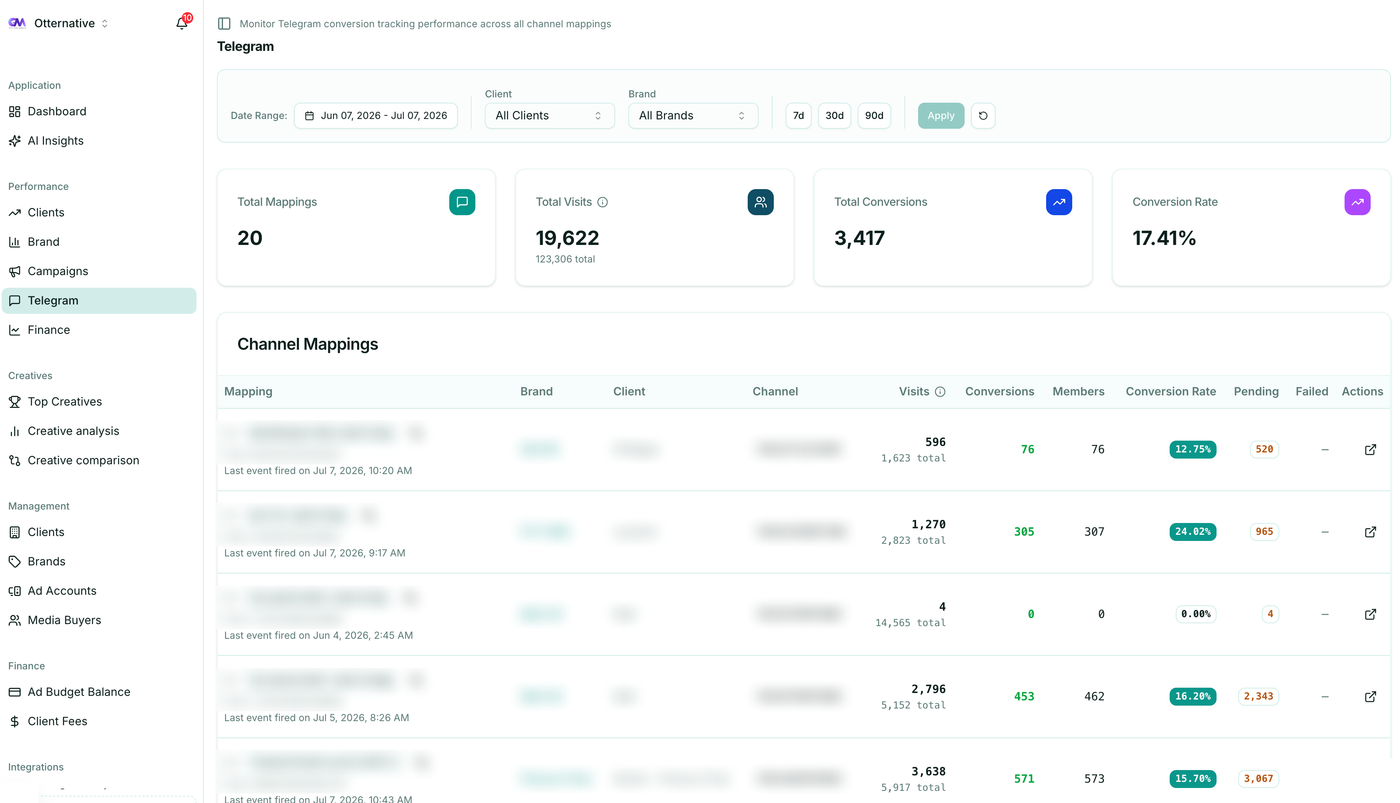
The agency got attribution live before touching creative. This is the step most teams skip, and it is the reason most Telegram campaigns can never be properly optimised. On Ott it is setup, not engineering — the connection, the mapping, and the CAPI postback are handled for you, so the first fortnight went to strategy instead of plumbing.
- The Telegram bot was mapped to the channel so joins could be detected and timestamped.
- Each ad’s destination carried the fbclid through to the join event, so a join could be tied back to a specific ad, ad set, and campaign.
- Join events were sent to Meta via the Conversions API as a custom conversion, giving the algorithm a real signal to optimise toward.
- FTD events from the broker’s side were logged as a second conversion using FTD tracking, so the agency could see cost-per-deposit, not just cost-per-join.
Testing spend in this phase was deliberately small (around CHF 1,200) across three creative angles and two 1% lookalikes of past depositors. Early cost-per-join landed near CHF 3.40. More importantly, the agency could already see that one of the three creatives produced joins that deposited at twice the rate of the others. That insight is impossible without end-to-end attribution — and it is exactly what Ott surfaces per creative from day one.
Phase 2: Optimising for deposits, not joins (Weeks 3-6)
With the signal flowing, the agency stopped reading the raw member count and started reading the funnel. Three things moved the numbers.
Source the lookalikes from depositors, not visitors
The standard advice is to build lookalikes from website visitors. In finance, that pulls in tyre-kickers. Rebuilding the 1% lookalike from a seed of confirmed FTDs (uploaded through manual conversion import where the CRM could not push directly) dropped cost-per-FTD noticeably, even though cost-per-join barely moved. Cheap joins and cheap deposits are not the same target.
Let creative compete on deposit rate
Three angles ran head to head:
- Signal proof: real (anonymised) trade calls and results from the channel
- Community: screenshots of an active, busy channel
- Product: the broker’s spreads and platform features
Community creative produced the cheapest joins. Signal-proof creative produced the cheapest deposits. Because the agency tracked both, it scaled the signal-proof angle even though it looked worse on the surface-level join metric. A team watching only member growth would have made the opposite, wrong call.
Watch the funnel, not the dashboard
Campaign triage surfaced one ad set that was burning budget on joins with a near-zero deposit rate, a classic sign of low-quality or incentivised traffic. Pausing it early protected the cost-per-FTD across the whole account.
By the end of Phase 2 cost-per-join had settled around CHF 2.80, and cost-per-FTD had improved by roughly a third versus the opening fortnight.
Phase 3: Scaling without losing the thread (Weeks 7-12)
Scaling a finance Meta account is mostly an exercise in not breaking what works.
- Budget rose 20 to 30% per week, never doubled overnight, to avoid resetting the learning phase.
- Creative was refreshed every two to three weeks to fight fatigue, with the strongest signal-proof concept iterated rather than replaced.
- Spend was spread across multiple Business Managers so a single restriction could not take the whole campaign offline. Because attribution was tied to the click and the join (not to one ad account), multi-brand and multi-account reporting stayed consistent even as accounts came and went.
- Ott’s budget balance and overdraft alerts kept prepaid ad accounts from silently running dry mid-flight, a real risk when you are juggling several Business Managers at once.
Across the scaling phase, joins continued at roughly CHF 2.70 each and the deposit rate held, which is the part that matters. Plenty of accounts can buy cheap joins at scale. Holding the deposit rate while scaling is the actual win.
What the numbers said
Aggregated across the quarter:
- By audience: depositor-seeded lookalikes beat visitor lookalikes on cost-per-FTD by a wide margin, even where cost-per-join was similar. Broad interest targeting was the most expensive on every metric.
- By creative: signal-proof creative had the lowest cost-per-FTD; community creative had the lowest cost-per-join. The gap between those two metrics is the entire argument for tracking deposits.
- By placement: Instagram feed and Stories drove the cheapest joins; the deposit rate was steadier from feed placements.
None of these conclusions are reachable if your reporting stops at the join. The recurring theme is that the cheapest join is frequently the most expensive deposit.
What didn’t work
- Optimising the campaign objective for joins alone. It trains Meta to find people who tap “join” and nothing else. Sending the FTD signal via CAPI gave the algorithm a reason to find depositors.
- One Business Manager. An early restriction wiped a chunk of in-platform history. Attribution that lived at the click and join level survived; reporting that depended on the ad account did not.
- Treating spreadsheets as the system of record. Pulling Meta numbers, Telegram joins, and CRM deposits into a weekly sheet by hand was slow and broke the moment an account changed. The fix was keeping all three in one place.
What made it repeatable
Strip the case study to its bones and every good decision traces back to the same foundation: attribution that never broke. Because each join was tied to its ad by the fbclid and fed back to Meta via CAPI, the agency could define success as the deposit, let deposit rate pick the winning creative, and spread spend across Business Managers without ever losing the thread.
None of that is bespoke engineering. Per-ad Telegram attribution, CAPI postbacks, cost-per-join next to cost-per-FTD, the Client → Brand → Ad Account hierarchy, and budget alerts across Business Managers are what Ott does as standard — at a flat monthly fee, so scaling the campaign never scales your tracking bill.
The whole case study comes down to one idea: in finance, a Telegram join is a leading indicator, not a result. Measure it that way and your scaling decisions stop being guesses. If you want to see which Meta ads are driving Telegram joins and deposits in your own account, start a free trial or talk to us about your funnel.